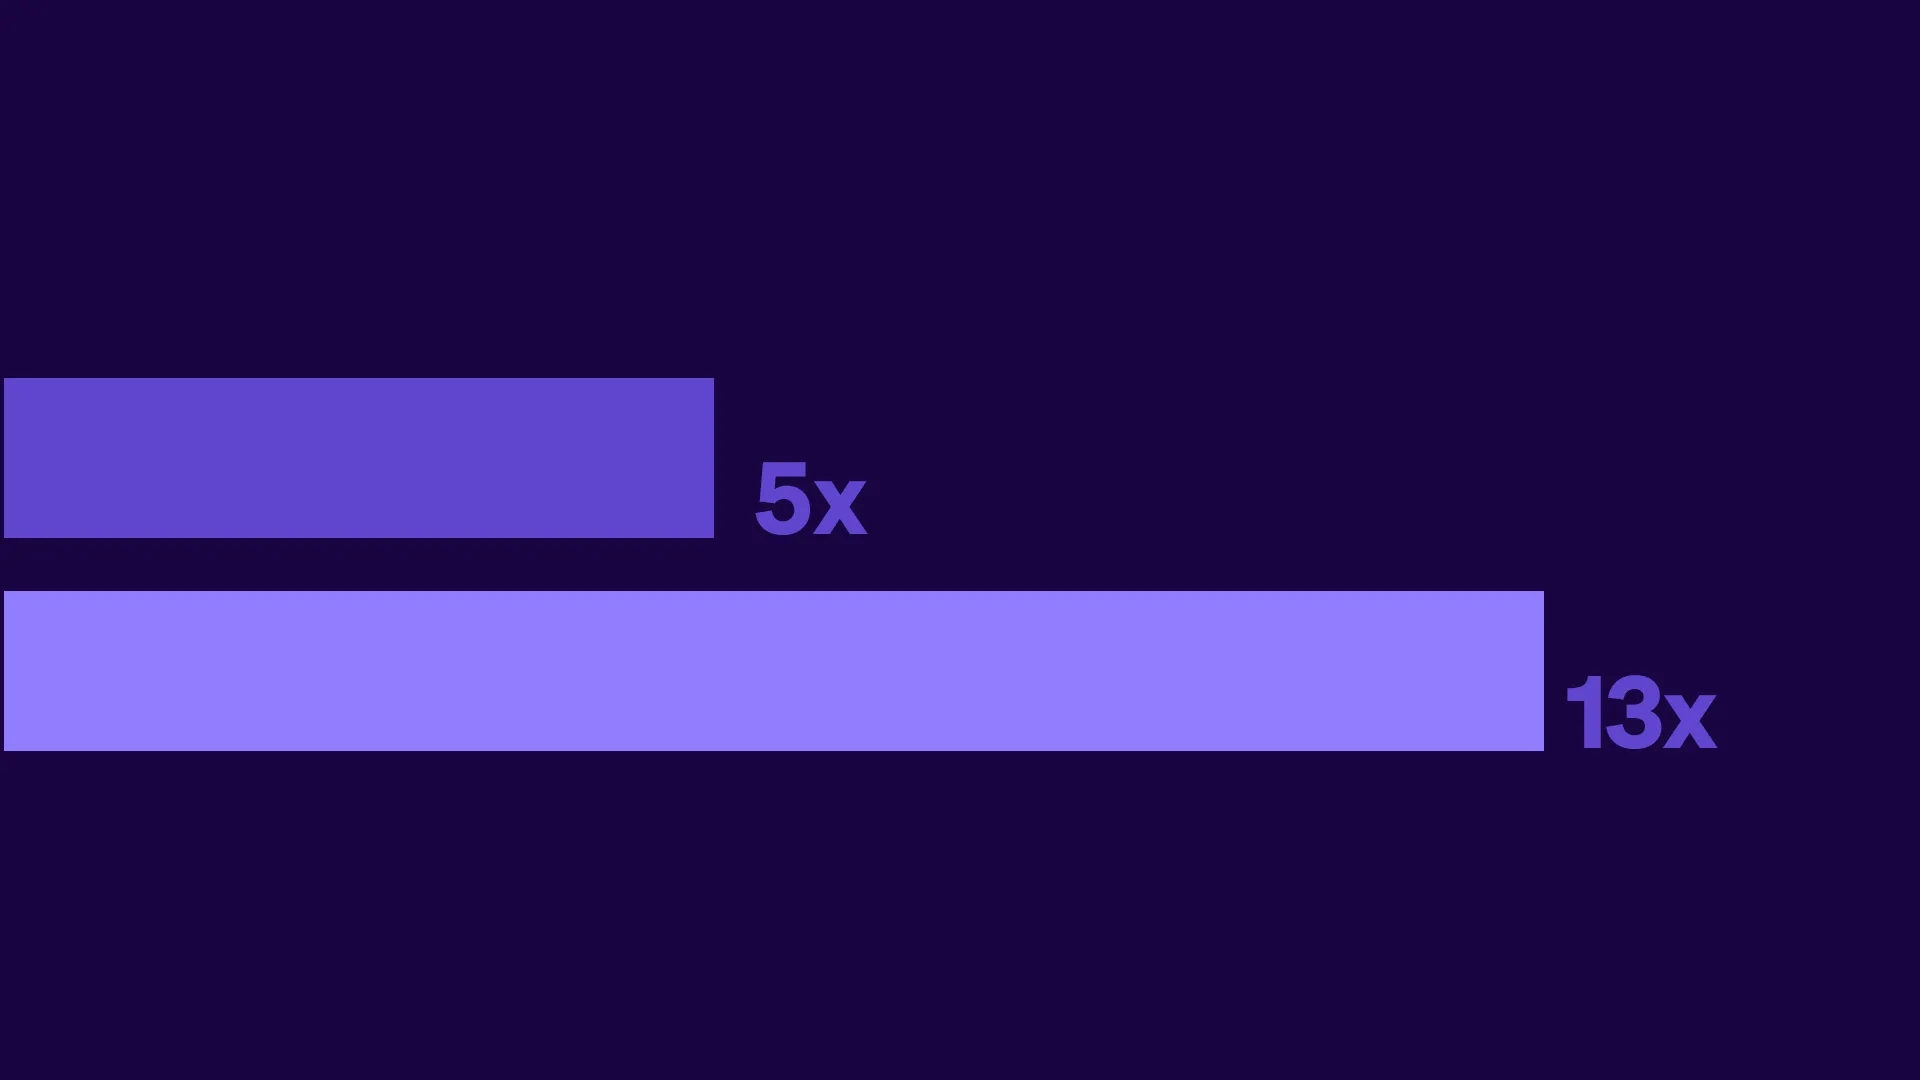
Part 2. The Comeback: Building to Lead in the Era of AI Michelle Longmire, MD
Part 1 of this essay opened with you in a clinic room on a Tuesday in March 2035, having just received a diagnosis of glioblastoma.1 You are offered a thirty-year-old standard of care and the same prognosis we are accustomed to today. Yet the medicine that would change that prognosis exists. It was approved in China twenty-six months earlier, tens of thousands of patients have already received it, and an FDA decision is expected sometime in 2037. Part 1 argued that this scenario is not a prediction. It is the endpoint of a trend line that is already established.
2 Seeing where the coordination burden actually falls, and what supervised AI systems can now absorb, is what persuaded me that this is the leverage the United States needs to lead what is likely to be the most consequential era in the history of drug development. The goal of this paper is to prompt a radical rethinking of the Western clinical development paradigm.
I. The Argument So Far Four findings from Part 1 carry into this one. The first is that the American disadvantage is operational rather than scientific. The United States originated roughly 48% of the world's early-stage drug programs in 2015 against China's 8%; by 2024 the figures were 37% and 32%.3 The pivot was not driven by better discovery science. A Phase 1 trial runs approximately seven months in China against seventeen in the United States.4 The regulatory clock itself is comparable: an investigational new drug application takes effect 30 days after receipt in the United States, China, and Australia alike. What follows the clock is not comparable. In the United States, institutional review board approval and contract negotiation can add up to 13 months before a single patient is enrolled; China requires sponsors to initiate the trial within 12 weeks of application.5 The regulatory clock is the one part of the American system that is already competitive. Everything surrounding it is not.
The second is that the enrollment gap is structural. Chinese trial activity concentrates in a small number of very large tertiary centers drawing on a larger denominator, with roughly 780,000 patients newly diagnosed annually in immuno-oncology indications against approximately 234,000 in the United States, and with fewer competing protocols per patient.6,7 American trials are dispersed, and at the academic centers where they do concentrate they compete with one another for the same referred population.
The third finding is the one this part builds on. The money in clinical development principally funds complex coordination. Per-patient clinical procedures and central laboratory work account for roughly 30% of a development budget. The remaining 70% funds coordination: administrative and project staff, site monitoring, site management, data collection and reconciliation, recruitment contracting, and document handling.8,9 Source-data verification alone, the practice of dispatching a person to a site to confirm that a value in a database matches a value on a source record, can account up to a quarter of a study's total budget10-12 and, under traditional monitoring, 40% of on-site CRA effort.13 Very little of this work is scientific or medical judgment (Figure 1).
FIGURE 1: Where the Clinical Development Budget Goes Representative allocation of a late-phase development budget based on published cost-component analyses. Approximately 70% of spend funds coordination and operations rather than evidence generation. Sources: references 8 to 10.
The fourth is that the consequences of this structure are measured in invaluable time and ownership rather than in individual line-item cost. A year of development time saved converts largely into a year of additional exclusive commercial life after approval, which for a program of any consequence is worth more than the entire cost of the trial that produced it. For an emerging company whose financing is released against data readouts, a quarter lost to operational drag is paid in dilution and financial duress. Two companies holding molecules of identical merit are not equally valuable if one can generate the same evidence in half the time.
Those four findings define the problem this part proposes to solve. The coordination layer is the cost, the delay, and part of the reason many patients are never offered a clinical trial as a healthcare option. It is also, increasingly, a tractable problem.
II. A New Labor Unlock What has changed is that the specific content of coordination work, meaning verification, reconciliation, documentation, structured drafting, and status propagation, now falls within the competence of supervised agentic systems operating over connected data. The half of trial cost that is operational labor is not, for the most part, the half requiring a human mind. It only required a human because the software could not close the loop.
The model that follows reallocates clinical labor from a rented headcount that executes the operational apparatus to a compressed expert core that supervises it. Agents operate under a risk-proportionate autonomy framework: the degree of independent action permitted scales inversely with the consequence of error, with consequential determinations routed to qualified humans for adjudication. The critical design discipline is distinguishing work that is essentially checking from work that is essentially judgment or relationship (Table 1).
TABLE 1: The Agentic Labor Model, Line by Line
Swipe to see the full table →
Budget line Share of budget What agentic operations absorb What necessarily remains human Compression
Administrative & project staff 17% Orchestration of status, handoffs, timelines and cross-system reconciliation; automated reporting Escalation, prioritization, sponsor judgment 65% Site monitoring & SDV 13% Continuous central and statistical monitoring; automated anomaly and outlier detection under RBQM Exception adjudication; investigator relationships; for-cause visits 70% Site management & retention 12% Scheduling, patient engagement and reminders, payment and query workflows Site and patient relationships; retention judgment 40% Data collection, management & reporting 11% Autonomous ingestion, edit checks, query generation and resolution, reconciliation, lock preparation Data standards; adjudication of ambiguous or contested values 70% Site recruitment & contracting 9% Feasibility analysis, site identification, budget and contract drafting Final site selection; negotiation 45% Regulatory, IRB & document management 8% Document generation, submission assembly, TMF filing and classification, completeness surveillance Regulatory strategy; scientific framing; sign-off 65% Per-patient procedures & central laboratory 30% Unchanged: the evidence the capital exists to generate Preserved in full 0%
Total development budget 100% Coordination falls from 70% to 28% of budget Evidence generation remains preserved in full Estimated budget reduction: 42%
Budget shares follow published late-phase cost-component analyses.8,9 Compression estimates are directional rather than measured, calibrated to the character of the work in each line: verification- and documentation-intensive functions compress most; relationship- and judgment-intensive functions compress least. Supporting evidence includes an average 44% reduction in queries among sites that reported fewer queries after adopting electronic source data,14 and an independent Tufts CSDD analysis of a deployed clinical monitoring agent reporting direct on-site monitoring cost reductions of $4.4 million per Phase 2 and $5.6 million per Phase 3 oncology trial.2 The derivation of each line is given in Appendix A. RBQM = risk-based quality management; SDV = source-data verification; TMF = trial master file.
The pattern is consistent and, on reflection, unsurprising. Functions that consist largely of checking that two representations of the same fact agree, such as source-data verification, data cleaning, document classification, and status reconciliation, compress by roughly two-thirds. Functions that depend on human relationships or irreducible judgment, such as investigator rapport, patient retention, site negotiation, medical causality assessment, and regulatory strategy, compress far less, and the human role within them is elevated rather than diminished, because the practitioners are freed from the administrative substrate that currently consumes their attention.
Weighted across the coordination lines, the model compresses coordination spend by approximately 60%: from 70 units of capital to roughly 28. The 30 units funding evidence generation are preserved in full. The same milestone is reached with about 42% less capital (Figure 2). The derivation of each line, its sensitivity to the assumptions, and a comparison with the first independent economic analysis of a deployed agent are given in Appendix A.
FIGURE 2: Same Milestone, Less Capital Modeled outcome of the Table 1 labor model applied to the Figure 1 budget structure. Coordination spend falls from 70 units of capital to roughly 28; the 30 units funding evidence generation are preserved in full; the same milestone is reached with about 42% less capital. Illustrative representation of published cost structures, not measured company performance.
The second ledger: time Capital is the ledger that Table 1 and Figure 2 keep. Time is the second ledger, and Section I argued it is the one that matters most. Development time is consumed by the same coordination layer that consumes 70% of the budget, and most of it is spent waiting on checking and drafting work rather than on science. Table 2 and Figure 3 map the critical path of a late-phase program to the delay each segment carries today, what an agentic operating model changes in it, and the recovery that has been measured or documented so far.
TABLE 2: Where Development Time Goes and What Agentic Operations Recover
Critical-path segment
What consumes the time today
What an agentic operating model changes
Measured or documented recovery
Study start-up: IRB review, site contracting, activation
In the United States, IRB approval and contract negotiation can add up to 13 months after the IND; site activation runs above 160 days, driven by budget and contract negotiation.5
Feasibility analysis, site identification, and first-draft budgets and contracts generated from the protocol and master templates; negotiation remains human and is reached weeks earlier
Documented delay only; recovery not yet measured. The negotiation itself compresses least (Table 1).
Enrollment
Eligible patients are never identified: 56% have no trial at their institution and no one is matching them elsewhere.15 Lagging sites are found at the monthly report, not the week they slip.
Continuous eligibility screening against every open protocol; continuous site visibility with early intervention at lagging sites
109 to 119 days of enrollment timeline removed per oncology trial (Tufts CSDD).2
Conduct: monitoring and data cleaning
Visits every 7 to 10 weeks; source verified in arrears; queries resolved in batches
Source read at the point of capture; discrepancies routed as they arise; visits triggered by signal rather than calendar
About 18 weeks of critical-path acceleration per trial from faster enrollment and earlier lock (Tufts CSDD).2
Database lock and closeout
Retrospective reconciliation of laboratory, safety, and IxRS data; query backlog cleared at the end
Continuous reconciliation; the lock date is a readiness state, not a scramble
About 2 weeks removed from database lock (Tufts CSDD).2
Between phases: assembly, submission, review
As much as 45% of development time is dead time between phases, consumed by paperwork rather than science (FDA commissioner).16
Inspection-ready data maintained continuously; submission assembly as document generation; real-time transmission to reviewers under the FDA Real-Time Clinical Trials initiative
Documented delay; recovery is the object of current FDA pilots.5,16,17
Delays in column two are from HHS Operation TrialBlazer,5 the Unger meta-analysis,15 and the FDA commissioner's statement at the April 2026 Real-Time Clinical Trials announcement.16 Recoveries in column four are from the Tufts CSDD analysis of a deployed clinical monitoring agent in oncology, which was funded by Medable.2 Segments without a measured recovery are left as documented delays rather than estimated; the time ledger is not modeled in Appendix A.
FIGURE 3: Time on the Phase 3 Critical Path: Documented Delay and Measured Recovery Measured recoveries (solid) are from the Tufts CSDD analysis of a deployed clinical monitoring agent in oncology trials, funded by Medable: 109 to 119 days of enrollment timeline and about two weeks at database lock, about 18 weeks of critical-path acceleration in total.2 Documented delays (hatched) are from HHS Operation TrialBlazer (up to 13 months of IRB review and contracting after the IND)5 and the FDA commissioner's statement that as much as 45% of development time is dead time between phases;16 neither has a measured agentic recovery yet. Weeks are shown to scale except where noted.
Two features of Table 2 and Figure 3 matter. First, the measured recoveries so far come from one agent in one line of the budget, monitoring, and they already sum to about 18 weeks on a Phase 3 critical path. The start-up and between-phase segments carry larger documented delays, up to 13 months and 45% of development time respectively, and no measured recovery yet, because those are the segments where agentic operations are newest and without third party established time or cost savings measures. Second, the time recovered compounds with the capital recovered: a trial that costs 42% less and finishes 18 weeks earlier reaches its readout on less money and raises its next round on the strength of a result rather than a forecast.
III. The Economics of Linear vs. Exponential Productivity The savings are consequential, but the structural change matters more. Under the present model, operational cost and productivity scale linearly with the number of headcount operating the trial, which is proportionate in turn to the patients, sites, data points, and elapsed months. These are precisely the quantities against which a contract research organization bills. Complexity is therefore not merely expensive; it is expensive in direct proportion to its extent, and protocol complexity has risen sharply over two decades without a corresponding improvement in success rates.18,19
Under an agentic operating model, that coupling breaks, and productivity scales exponentially rather than in proportion to headcount. The marginal cost of an additional site, an additional ten thousand data points, or an additional safety case approaches zero, while cost concentrates on the density of genuine judgment a program requires. Three consequences follow for a capital-constrained sponsor. Its financing round reaches materially further, extending the runway at constant burn. Its team carries more programs in parallel without hiring, since progress is decoupled from headcount. And its time-to-milestone compresses, which is the variable that determines whether it raises its next round on favorable terms or on unfavorable ones. Section I put the exchange rate on that last variable: a year of development time saved is largely a year of exclusive commercial life gained, which for a program of any consequence is worth more than the trial that produced it. On that exchange rate, the 18 weeks a single monitoring agent recovers per trial2 is worth roughly a third of a year of exclusivity, before any of the larger start-up and between-phase delays in Table 2 are touched.
Capital efficiency and time-to-inflection are the two variables that govern the life of an emerging biotechnology company. They are exactly the variables this model moves.
An independent analysis now puts numbers on the relative weight of the two. The Tufts Center for the Study of Drug Development modeled a deployed clinical monitoring agent across benchmark oncology programs and found direct on-site monitoring savings of $4.4 million per Phase 2 trial and $5.6 million per Phase 3 trial, about 18 weeks of critical-path acceleration from faster enrollment and earlier database lock, and expected net present value gains of $7.5 million per indication for a Phase 2 trial and $21 million for a Phase 3 trial, a return of 64 to 82 times the implementation cost.2 The instructive comparison is between the two Phase 3 figures. The cost saving is $5.6 million; the eNPV gain is $21 million. Roughly three-quarters of the value the agent creates is the value of a shorter program, not a cheaper one. The variable that moves the economics of a development program is elapsed time, and that is the variable an agentic operating model is built to compress.
IV. Agentic AI in Participant Identification, Enrollment, and Evidence Generation An agentic labor model lowers the capital required for biomedical innovation, but it leaves the harder constraint untouched: finding the patients to participate in trials. Section I described China's enrollment advantage as structural, with patients concentrated in a small number of very large centers, drawn from a larger denominator and competed over by fewer protocols. The United States cannot replicate that approach, and it should not try. Our advantage is not physical concentration but digital ubiquity. American EHR adoption is now effectively universal. As of 2024, more than 99% of nonfederal acute care hospitals and roughly 84% of office-based physicians use a certified electronic health record, and 95% of office-based physicians use an EHR of some kind, the product of the HITECH Act and more than a decade of sustained investment.20-23 The result is one of the deepest longitudinal clinical data assets in the world, spanning nearly the entire population across every care setting rather than a concentrated fraction of it. The problem is that the asset is fragmented, scattered across thousands of independent systems, institutions, and formats, which is why a patient in one community remains invisible to a trial recruiting three counties away.
The American enrollment problem is not patient reluctance This is the most misunderstood fact in American clinical research, and correcting it changes what the solution has to be. In the definitive meta-analysis of participation barriers, 56% of cancer patients did not enroll in a trial because no trial for their cancer type and stage was available at the institution treating them. Of those who did have one available, roughly 22% were ineligible under the protocol's criteria. Only about 15% of patients who were both offered a trial and eligible for it declined.15 Structural and clinical barriers alone make participation unachievable for more than three of every four patients. Enrollment runs 16% at academic centers against 7% in community settings, where most Americans are actually treated, and overall participation among adults with cancer sits between 2% and 8%.15,24
Read those numbers together and the conventional framing inverts. American patients are not refusing to participate in clinical research; they are, overwhelmingly, never asked. The 234,000 newly diagnosed immuno-oncology patients in Section I are not a small denominator relative to China's 780,000. They are a large and almost entirely unreached one.
The burden sits where it cannot be carried Under the present model, identifying a trial-eligible patient is the uncompensated work of a practicing physician. She must know which studies exist, hold their inclusion and exclusion criteria in mind, recognize a match during a fifteen-minute encounter, and then explain an unfamiliar protocol, its randomization, and its risks, all using clinical time reimbursed for delivering care and not for conducting research. In a community oncology practice with no research coordinator and no trial portfolio, this is not a reasonable expectation. It is an unfunded mandate, and it goes unmet for exactly the reason unfunded mandates always do.25
What an agentic layer changes Once patient data can be read continuously rather than recalled episodically, three functions become tractable. The first is identification: eligibility screening run against both structured and unstructured records, including notes, pathology, imaging, and genomic reports, evaluated against the criteria of every open protocol continuously rather than at the moment a physician happens to think of it. Reconciling a record against hundreds of protocols is checking-intensive work of exactly the kind described in Section II, and no clinician can perform it at scale. The second is education: explanatory material generated for a specific patient and protocol, reviewed by the investigator and delivered at the patient's reading level and in their language before the visit rather than compressed into it. The third is referral: surfacing trials at other institutions, which is where the current system fails most completely and where the 56% figure is generated. Each of the three is also a time function. Enrollment is the longest segment of a late-phase critical path, and the first measured effect of continuous site visibility alone, before any cross-institution matching, is 109 to 119 days removed from the enrollment timeline of an oncology trial.2 Matching across the virtual denominator addresses the larger constraint, the patients who are never found at all.
Together these treat the nation's distributed records as a single virtual denominator, matching patients to protocols wherever they receive care and bringing the trial to the participant rather than the participant to a megacenter. This is the American answer to Chinese concentration: assembling in software the enrollment pool that China assembles in concrete and policy, on a base of more total patients, deeper data, and a national interoperability framework being built precisely to move clinical information across institutional boundaries.26,27
Conducting the trial around the patient Identification and matching bring a patient to the threshold of a trial; decentralized clinical trial technologies carry them across it without requiring that they uproot their care. Remote and hybrid designs, including electronic consent, telehealth visits, local phlebotomy and imaging, direct-to-patient shipment of investigational product, and continuous endpoint capture from wearables and connected devices, let much of a protocol be conducted in or near the patient's home under the supervision of the treating team rather than concentrated at a distant research site.28 For the community patient who is never asked today, this is the difference between a trial that is nominally open and one that is practically reachable, and it is what makes the national footprint implied by a virtual denominator operationally real rather than merely conceivable. It is also the natural complement to the agentic layer: the same continuously read record that surfaces a match can generate the visit schedule, the reminders, the remote data capture, and the reconciliation a decentralized protocol depends on, and because the labor model already drives the marginal cost of an additional site or participant toward zero, distance stops being the budget line that decides who is allowed to enroll.
Fewer patients on placebo: longitudinal controls and digital twins The same longitudinal data asset that makes patients findable also makes part of the control group reconstructable. For conditions with a well-characterized natural history and reliable real-world capture, a curated external or synthetic control cohort assembled from historical longitudinal records can supplement, and in narrowly defined settings stand in for, a concurrent control arm, reducing the number of patients who must be enrolled and randomized away from the investigational therapy.29 The constraint here is evidentiary rather than technical: regulators accept externally controlled comparisons only where confounding can be credibly addressed and the source data meet the same integrity standards as prospectively collected evidence, which is why the prevailing use is augmentation of a randomized control rather than its wholesale replacement.
Digital twins extend the same logic to the individual patient. A prognostic model trained on longitudinal data can forecast, at the moment of enrollment, the trajectory a given participant would most likely have followed under standard of care. Used as a pre-specified prognostic covariate, that twin raises the statistical power of a trial of fixed size, or holds power constant while enrolling fewer patients, most valuably fewer patients allocated to placebo.30-32 The method has moved from proposal to qualified practice, with regulatory pathways now recognizing prognostic covariate adjustment as an acceptable, pre-registered technique rather than a post hoc maneuver. For a capital-constrained sponsor the effect compounds with everything above: a smaller, faster, more widely distributed trial that reaches its readout on less capital while asking fewer patients to forgo the therapy under study.
Oversight is not optional The autonomy gradient here must be steeper than in the labor model, because the object being acted upon is a person, not a record. Informed consent is a clinical act and must remain one: an agent may prepare, explain, translate, and document, but it may not obtain consent, and a qualified investigator must adjudicate final eligibility. Patient contact must occur under IRB-approved protocols with explicit provisions for agent-generated material, and data use must satisfy HIPAA and the governance of every institution whose records are queried.
One failure mode deserves specific attention. A matching system trained on historical trial populations will reproduce their demographics, and it will do so invisibly. Because American enrollment already under-represents Black, Hispanic, rural, and older patients, a system optimized for match volume alone would efficiently entrench that distribution. Differential match and referral rates by race, ethnicity, geography, insurance status, and age must be monitored as a primary output, not audited annually as a secondary one.
The same discipline extends to the constructed comparators. An external control cohort or a prognostic digital twin is only as trustworthy as the data and the model behind it, and both must be specified before the trial reads out, validated against the population they are meant to represent, and held to the ALCOA+ integrity and change-control standards described in Section V. A model that silently drifts, or that was fit on a population unlike the one enrolled, imports bias precisely where it is hardest to see. A prognostic twin must also be prevented from encoding the treatment assignment, and its performance monitored across the same demographic strata as the matching layer, so that a technique adopted to enroll fewer patients does not quietly narrow whom the evidence represents.
V. Regulatory Efficiency, Quality Improvements, and Greater Transparency A well-implemented agentic clinical development strategy does not treat GxP compliance as a constraint bolted on after the fact; it treats regulatory rigor as a design input. Agentic systems differ from the deterministic software that clinical operations have validated for decades because they act rather than merely calculate. They select records, reconcile discrepancies, draft queries, and decide when to escalate. That autonomy raises the bar on the familiar GxP obligations. Every action an agent takes must be captured in an immutable audit trail that preserves ALCOA+ data integrity, meaning the outputs remain attributable, legible, contemporaneous, original, and accurate even when a model rather than a person performed the step.33,34 Validation must move from a one-time qualification event to continuous assurance, because a system that learns or updates cannot be frozen and forgotten. Frameworks such as GAMP 5 and the FDA's Computer Software Assurance guidance already point in this direction, emphasizing risk-based, critical-thinking approaches over exhaustive documentation, and agentic architectures are precisely the case those frameworks anticipated.35,36
Meeting these requirements demands controls engineered specifically for agentic clinical development platforms. Operating boundaries must be explicit, so that an agent knows which decisions it may finalize and which it must route to a qualified human for review. Human oversight becomes a formal role, with reviewers accountable for the judgments the system surfaces. Explainability and traceability are not optional features but evidentiary necessities, since a sponsor must be able to reconstruct why an agent flagged one data point and cleared another. Change control extends to prompts, models, and the data the agent draws upon, each of which is a configuration item subject to the same discipline as any validated system. Handled well, this produces a fully documented, tamper-evident record of clinical conduct that is, in many respects, more complete, more contemporaneous, and more consistently applied than the manual processes it replaces.
That completeness is where obligation turns into opportunity. The same audit trail that satisfies an inspector is also a live, structured stream of evidence, and a regulator who can read that stream does not have to wait for it to be assembled, cleaned, and submitted months later. The FDA commissioner has described as much as 45% of drug development time as dead time, consumed by the gaps between phases and the paperwork that fills them rather than by science.16 An agentic system that maintains inspection-ready data continuously is the mechanism that recovers that lost time, because verification shifts from a retrospective scramble to an ongoing state. The first measured instance is small and specific: about two weeks removed from database lock when reconciliation runs continuously rather than at the end.2 The same mechanism, applied to the assembly and submission work between phases, is what the 45% figure describes. Compliance and speed, long treated as a tradeoff, begin to reinforce one another.
Current FDA efforts show this convergence taking shape. Under Operation TrialBlazer, the agency and HHS have moved to modernize development end-to-end, from an expedited IND pilot and clearer phase-appropriate CMC expectations to updated master-protocol guidance for basket, umbrella, and platform trials. In parallel, the FDA's Real-Time Clinical Trials initiative lets reviewers monitor pre-agreed safety signals and efficacy endpoints as they emerge through cloud-based platforms, with early sponsors AstraZeneca and Amgen already transmitting live trial data, and a companion AI pilot exploring how to optimize early-phase studies.5,16,17 These programs presuppose exactly the capability that disciplined agentic systems provide: trustworthy, continuously validated, machine-readable evidence. In that light, a well-implemented agentic strategy is not only how a sponsor satisfies GxP requirements. It is how the sponsor and the regulator together convert compliance into regulatory efficiency.
VI. Conclusion: Let's Build the Agentic Medicine Machine What Swanson and Boyer launched in 1976 was not just a medicine. It was a machine for making medicines, an industry built on a method for turning scientific insight into therapies that change lives.37 Recombinant DNA treated no disease. What changed was what became possible to manufacture, and insulin was the first proof of how profoundly that would bend the trajectory of human health. The genius of the American biopharmaceutical industry has always been this pairing: innovation in the science, matched by innovation in the manufacturing technologies that make an entire class of products possible in the first place.
Today, agentic AI lets us approach clinical development with the same degree of innovation we have delivered in manufacturing technologies, where system-based automation enables speed, scale, and quality, and the job for humans is judgment and strategic design. We can now automate the reconciliation currently performed by tens of thousands of skilled people, letting supervised software carry that work, and the same milestone is reached with roughly 42% less capital. The same work, done continuously rather than in arrears, returns time as well as money: 18 weeks per trial from one agent in one budget line, measured,2 against a critical path that still carries up to 13 months of pre-enrollment delay and development programs in which nearly half the elapsed time is spent between phases.5,16 Cost is the ledger that makes a program affordable. Time is the ledger that decides who owns the medicine.
Agentic systems in combination with decentralized clinical trial technologies can help us address the massive enrollment problem we face in the United States by connecting a fragmented participant population, so that the 56% of patients for whom no trial exists at their own institution or community can be given access to trials. We can maximize the health benefits of our investments in electronic medical records by leveraging agentic systems to connect participants' health data for identifying, matching, and even educating individuals on clinical trials.
Our biotechnology industry is the engine that will unlock the coming golden era of human health, and it needs an operating system in which cost tracks to impact and return on investment rather than to headcount, one that lowers the capital required by our most innovative biotech companies so they can stay competitive and keep investing in breakthrough science. This is not an efficiency program. It changes how many shots on goal the country gets, and how much of the promise of AI we convert into real health benefits.
Which returns us, finally, to the clinic room in 2035 where Part 1 began. We have aggressively re-engineered the American clinical development machine. Now, you have treatment options that meaningfully change your prognosis. The first of the drugs was approved two years ago. Four more have followed, all of them from American biotech companies, each moving from first-in-human to approval in under three years.
What changed? The United States built a clinical drug development operating model engineered for the era of AI: an agentic system and AI-aligned regulatory model that executes the contracts in days, verifies data at the point of capture, and enables every American to consider relevant clinical research as a care option. This is a system built to deliver velocity and leverage, a system built to win the biotechnology race in the greatest era of human medical history in the making.
APPENDIX A: Derivation of the Table 1 Compression Estimates A.1 Method Table 1 assigns a compression percentage to each coordination line of a late-phase development budget and arrives at a 42% budget reduction. The percentages are modeled estimates, not measured outcomes. This appendix shows the arithmetic so that a reader can substitute other assumptions and judge the result on its inputs.
Each budget line is decomposed into five activities with a share of the line's labor cost. Each activity is assigned one of five work types, and each type carries a net absorption rate: the fraction of the activity's cost that supervised agentic operation removes after the cost of human supervision and compute is paid. Line compression is the share-weighted sum, rounded to the nearest five points; budget reduction is the sum of budget share times compression. The classification is of the work, not the job title: a single CRA does checking, drafting, judgment, and relationship work in one week, and each is scored separately. All percentages and budget points are reported as whole numbers.
A.2 Work types and absorption rates TABLE A1: Work Types and Base-Case Absorption Rates
Work type
Definition
Base rate
Range tested
Checking
Verifying that two representations of the same fact agree: source against database, document against reference model, status against system of record
85%
70% to 95%
Workflow
Scheduling, routing, reminders, handoffs, status propagation, payment triggers; deterministic once the rule is known
80%
65% to 90%
Structured drafting
First drafts of documents whose structure is fixed by template or standard: visit reports, contracts, submission packages, patient materials
70%
55% to 80%
Judgment
Adjudication of ambiguous or contested matters, prioritization, strategy, final selection
15%
10% to 20%
Relationship
Work whose value depends on a human counterpart: negotiation, investigator rapport, patient retention, in-person visits
10%
5% to 15%
Checking (85%) is the comparison of two representations of one fact. Source-data verification consumes roughly a quarter of a trial budget while producing no measurable gain in accuracy,10,11 and electronic source capture, which removes only the transcription step, produced an average 44% reduction in queries among sites that reported fewer queries after adopting it.14 An agent that performs the comparison and routes only disagreements to a human leaves adjudication as the residual, carried at 15%. Workflow (80%) is the propagation of a known rule; the residual covers rule specification and exceptions. Structured drafting (70%) produces documents of fixed form from data the agent holds; the residual is reviewer and editing time. Judgment (15%) and relationship (10%) are the human decision and the human counterpart. The HHS TrialBlazer roadmap identifies budget and contract negotiation as the main driver of site activation times above 160 days,5 which is why recruitment compresses least.
A.3 Line-by-line derivation Tables A2 to A7 give each coordination line. Activity shares are the model's estimate of how the line's cost is distributed and are the inputs most worth replacing with a sponsor's own time-and-motion data. The per-patient procedures and laboratory line (30%) is held at zero by construction.
TABLE A2: Administrative & project staff (17% of budget)
Activity
Share of line
Work type
AI Work Absorption
Points
Status tracking, dashboard and report assembly, cross-system reconciliation
40%
Checking
85%
34
Meeting preparation, minutes, action-item and timeline maintenance
25%
Structured drafting
70%
18
Vendor and site handoffs, workflow routing, document circulation
12%
Workflow
80%
10
Escalation, prioritization, scope and budget judgment
18%
Judgment
15%
3
Sponsor and vendor relationship management
5%
Relationship
10%
1
Line compression
100%
64 → 65%
TABLE A3: Site monitoring & SDV (13% of budget)
Activity
Share of line
Work type
AI Work Absorption
Points
On-site source-data verification and transcription checking
50%
Checking
85%
43
Travel and visit logistics
15%
Workflow
80%
12
Monitoring visit reports, follow-up letters, action-item tracking
15%
Structured drafting
70%
11
Protocol deviation and exception adjudication
12%
Judgment
15%
2
Investigator relationship, for-cause and triggered visits
8%
Relationship
10%
1
Line compression
100%
68 → 70%
TABLE A4: Site management & retention (12% of budget)
Activity
Share of line
Work type
AI Work Absorption
Points
Visit scheduling, window tracking, participant reminders
20%
Workflow
80%
16
Site payment processing and query follow-up workflows
12%
Checking
85%
10
Participant engagement and education materials
10%
Structured drafting
70%
7
Site relationship management, issue resolution, performance coaching
33%
Relationship
10%
3
Retention judgment and participant relationship
25%
Judgment
15%
4
Line compression
100%
40 → 40%
TABLE A5: Data collection, management & reporting (11% of budget)
Activity
Share of line
Work type
AI Work Absorption
Points
Data ingestion, edit checks, automated query generation
40%
Checking
85%
34
Query resolution follow-up; laboratory, safety and IxRS reconciliation
25%
Checking
85%
21
Database lock preparation, listings, interim data packages
12%
Structured drafting
70%
8
Data standards, CRF and specification design
13%
Judgment
15%
2
Adjudication of contested values, medical coding review
10%
Judgment
15%
2
Line compression
100%
67 → 65%
TABLE A6: Site recruitment & contracting (9% of budget)
Activity
Share of line
Work type
AI Work Absorption
Points
Feasibility questionnaire distribution and analysis
18%
Checking
85%
15
Site identification and historical performance review
12%
Checking
85%
10
Budget and contract drafting, redline tracking
20%
Structured drafting
70%
14
Budget and legal negotiation
35%
Relationship
10%
4
Final site selection, qualification visits
15%
Judgment
15%
2
Line compression
100%
45 → 45%
TABLE A7: Regulatory, IRB & document management (8% of budget)
Activity
Share of line
Work type
AI Work Absorption
Points
TMF filing, classification, completeness and quality surveillance
40%
Checking
85%
34
Submission and IRB package assembly
25%
Structured drafting
70%
18
Document generation: consent localization, cover letters, notifications
12%
Structured drafting
70%
8
Regulatory strategy and scientific framing
15%
Judgment
15%
2
Sign-off and regulatory authority interaction
8%
Relationship
10%
1
Line compression
100%
63 → 65%
Points equal share of line times absorption rate. The weighted sum is rounded to the nearest five, the value in Table 1.
A.4 Roll-up and sensitivity TABLE A8: Budget Reduction by Line
Budget line
Share of budget
Compression
Budget points saved
Administrative & project staff
17%
65%
11
Site monitoring & SDV
13%
70%
9
Site management & retention
12%
40%
5
Data collection, management & reporting
11%
70%
8
Site recruitment & contracting
9%
45%
4
Regulatory, IRB & document management
8%
65%
5
Total development budget
100%
42 points saved
Coordination spend falls from 70 points to 28, a weighted compression of 60% across the six lines, and capital to milestone falls from 100 to 58. Lowering every absorption rate (checking 70%, workflow 65%, drafting 55%, judgment 10%, relationship 5%) still removes 33 points; raising them (95%, 90%, 80%, 20%, 15%) removes 47. The uncertainty is whether the saving is a third or a half of the budget, not whether it exists. Activity shares matter less: moving ten points of share from checking to judgment within one line changes the total by under one point.
A.5 External check: the Tufts CSDD monitoring agent analysis In August 2026 Medable announced a Tufts Center for the Study of Drug Development analysis of its Clinical Monitoring Agent, built on Tufts CSDD benchmark data for oncology programs and on time-savings and cost data supplied by Medable, and valued with Tufts' expected net present value (eNPV) framework.2 The analysis was funded by Medable. It is the first measured, program-level economics for any line in Table 1 and is reported here as a check on the modeled 70% for site monitoring and SDV, not as an input to it.
TABLE A9: Tufts CSDD Findings for a Deployed Clinical Monitoring Agent, Oncology Program
Measure
Phase 2 trial
Phase 3 trial
Phase 2 + 3
Direct operating cost reduction, on-site monitoring (per trial)
$4.4 million
$5.6 million
Off-site administrative monitoring efficiencies, CRA time reallocable (not in eNPV)
$0.6 million
$1.7 million
Enrollment timeline reduction
109 to 119 days
Database lock, closeout shortening
about 2 weeks
Critical-path acceleration
about 18 weeks
Expected net present value gain per indication
$7.5 million
$21 million
$11.3 million
Return on investment
64x
82x
Source: reference 2. eNPV combines cost savings with the value of earlier revenue; the Phase 2 + 3 column is a combined development program as modeled, not the sum of the single-trial columns.
Three things in the findings bear on Table A3. First, the savings decompose as the activity model does. The direct saving comes from fewer on-site visits and less travel, the activities Table A3 classifies as checking and workflow and carries at 85% and 80%. The separately reported administrative efficiencies correspond to the visit-report and follow-up activities carried at 70%. Tufts excluded the second component from eNPV because it is reallocated CRA time rather than cash; the model here counts it, because reallocated time is a budget saving to the sponsor that funds the headcount.
Second, the savings are reported in dollars per trial, not as a share of the monitoring budget, and the announcement does not give the baseline on-site monitoring cost of the Tufts oncology benchmark. The conversion to a line compression should therefore wait for the full Tufts analysis rather than be made from a generic budget share, since oncology monitoring costs run above the cross-therapeutic 13% used in Figure 1. What the published figures establish is the order of magnitude: several million dollars of on-site monitoring cost removed per trial, which is consistent with a compression of the line in the range Table 1 assigns and not with a modest one.
Third, the analysis measures what the Table 1 model excludes. Section A.6 notes that the model prices labor, not time. Tufts found roughly 18 weeks of critical-path acceleration, most of it from faster enrollment, and valued the whole effect through eNPV at $21 million per Phase 3 indication. Direct cost savings of $5.6 million account for roughly a quarter of that figure; the remainder is the value of earlier revenue from a shorter program. That is the quantity Section III of the main text argues is larger than the cost saving, and it is the first measured support for the argument. It does not enter the 42% figure, which remains a labor-cost estimate.
The Tufts base case also specifies how on-site CRA effort is distributed across activities in each monitoring scenario (Table A10). These assumptions, extrapolated by Tufts from its prior monitoring studies, are the closest available analogue to the activity shares in Table A3 and are reported here as data on file.13
TABLE A10: On-Site CRA Effort by Activity, Tufts CSDD Base-Case Assumptions
On-site activity
Traditional monitoring
Risk-based monitoring
Monitoring agent scenario
Source-data verification (SDV)
40%
33%
28%
Source-data review (SDR)
41%
43%
38%
Other monitoring activities
19%
24%
34%
Source: Tufts CSDD model assumptions, base case, July 2026, data on file.13 Shares are of on-site CRA effort; travel is assumed at 15% of CRA time under the RBM and agent scenarios and is excluded from these shares.
Two points follow. First, the direction matches Table A3. Under the agent scenario SDV falls from 40% to 28% of on-site effort and SDR from 41% to 38%, while other monitoring activities, the investigator-facing and judgment work that Table A3 classifies as relationship and judgment, rise from 19% to 34%. That is the reallocation Section II describes: checking compresses, and the human share of the remaining work shifts toward what requires a human. Second, the magnitude is conservative relative to Table A3. Tufts holds SDV at 28% of on-site effort in the agent scenario, a reduction of about 30% in its share, whereas Table A3 assigns the SDV activity an 85% absorption rate on the assumption that the comparison step is largely removed. The Tufts figure describes a first deployment in which the agent reduces on-site source data verification rather than replacing it; the Table A3 rate describes the mature model. The modeled 70% for the monitoring line should be read with that difference in mind, and the measured per-trial savings in Table A9 were produced under the more conservative assumption.
A.6 What the model excludes The model prices labor, not elapsed time (the time ledger is set out in Table 2 of the main text and is not modeled here); one-time validation, integration, and change-management costs are not amortized into per-trial figures; protocol complexity is held constant, so the benefit for complex protocols is understated; and each saving is attributed to one line, so interactions such as fewer queries also reducing monitoring burden are not counted. Activity shares and absorption rates should be replaced line by line as measured deployment data accumulate. The model is a scaffold for that replacement, not a substitute for it.
VII. References 1. Longmire M. Restoring the American biotechnology edge. Part 1: The erosion. Medable Knowledge Center. October 5, 2026. Accessed October 23, 2026. https://www.medable.com/knowledge-center/blog-restoring-the-american-biotechnology-edge
2. Medable Inc. New Tufts CSDD analysis finds AI agents can deliver up to $21 million in net financial value per drug development program and up to 82x ROI [press release]. August 12, 2026. Accessed October 22, 2026. https://www.medable.com/newsroom/new-tufts-csdd-analysis-finds-ai-agents-can-deliver-up-to-21-million-in-net-financial-value-per-drug-development-program-and-up-to-82x-roi
3. Kang SY, Ji Y. Geographic shifts in early-stage biopharmaceutical innovation. JAMA. 2026;335(15):1355-1357. doi:10.1001/jama.2026.1962
4. GlobalData. Clinical Trials in China Are Faster Than US. PharmaTrends. GlobalData Plc; 2026. Accessed October 22, 2026. https://www.globaldata.com/health-economics/pharmatrends/Clinical-Trials-in-China-are-Faster-Than-US.pdf
5. US Department of Health and Human Services. Operation TrialBlazer: Roadmap to Maintaining U.S. Leadership in Clinical Research. HHS; 2026. Accessed October 22, 2026. https://www.hhs.gov/sites/default/files/operation-trialblazer.pdf
6. Miseta E. Report reflects huge growth of clinical trials in China. Clinical Leader. December 14, 2021. Accessed October 22, 2026. https://www.clinicalleader.com/doc/report-reflects-huge-growth-of-clinical-trials-in-china-0001
7. Welte J. China's trial advantage: tracking nation's growth in pharma innovation and global investment. Pharm Exec. 2025;45(5). Accessed October 22, 2026. https://www.pharmexec.com/view/china-s-trial-advantage-tracking-nation-s-growth-in-pharma-innovation-and-global-investment
8. Sertkaya A, Wong HH, Jessup A, Beleche T. Key cost drivers of pharmaceutical clinical trials in the United States. Clin Trials. 2016;13(2):117-126. doi:10.1177/1740774515625964
9. Sertkaya A, Birkenbach A, Berlind A, Eyraud J. Examination of Clinical Trial Costs and Barriers for Drug Development. Report prepared for the Office of the Assistant Secretary for Planning and Evaluation, US Department of Health and Human Services. Eastern Research Group; 2014.
10. Andersen JR, Byrjalsen I, Bihlet A, et al. Impact of source data verification on data quality in clinical trials: an empirical post hoc analysis of three phase 3 randomized clinical trials. Br J Clin Pharmacol. 2015;79(4):660-668. doi:10.1111/bcp.12531
11. Sheetz N, Wilson B, Benedict J, et al. Evaluating source data verification as a quality control measure in clinical trials. Ther Innov Regul Sci. 2014;48(6):671-680. doi:10.1177/2168479014554400
12. Tantsyura V, Grimes I, Mitchel J, et al. Risk-based source data verification approaches: pros and cons. Drug Inf J. 2010;44(6):745-756.
13. Tufts Center for the Study of Drug Development. Clinical monitoring agent expected net present value financial model for oncology drug development: model assumptions, base case. Prepared for Medable Inc; July 2026. Data on file.
14. Alsumidaie M. Study shows eSource can improve clinical trial data quality. Applied Clinical Trials. December 8, 2015. Accessed October 23, 2026. https://www.appliedclinicaltrialsonline.com/view/study-shows-esource-can-improve-clinical-trial-data-quality
15. Unger JM, Vaidya R, Hershman DL, Minasian LM, Fleury ME. Systematic review and meta-analysis of the magnitude of structural, clinical, and physician and patient barriers to cancer clinical trial participation. J Natl Cancer Inst. 2019;111(3):245-255. doi:10.1093/jnci/djy221
16. US Food and Drug Administration. FDA announces real-time clinical trials initiative and two proof-of-concept trials [press release]. April 28, 2026.
17. US Food and Drug Administration. FDA launches Expedited IND Pilot, begins accepting applications [press release]. September 15, 2026.
18. Getz KA, Campo RA. New benchmarks characterizing growth in protocol design complexity. Ther Innov Regul Sci. 2018;52(1):22-28. doi:10.1177/2168479017713039
19. Wong CH, Siah KW, Lo AW. Estimation of clinical trial success rates and related parameters. Biostatistics. 2019;20(2):273-286. doi:10.1093/biostatistics/kxx069
20. Office of the National Coordinator for Health Information Technology. Non-Federal Acute Care Hospital Electronic Health Record Adoption, 2008-2024. ONC Data Brief. US Department of Health and Human Services; 2026. Accessed October 22, 2026. https://healthit.gov/news/non-federal-acute-care-hospital-electronic-health-record-adoption-2008-2024/
21. Office of the National Coordinator for Health Information Technology. Office-Based Physician Electronic Health Record Adoption, 2008-2024. ONC Data Brief. US Department of Health and Human Services; June 30, 2026. Accessed October 22, 2026. https://healthit.gov/news/office-based-physician-electronic-health-record-adoption-2008-2024/
22. National Center for Health Statistics. National Electronic Health Records Survey (NEHRS): 2024 results. Centers for Disease Control and Prevention. Accessed October 22, 2026. https://www.cdc.gov/nchs/nehrs/results/index.html
23. Health Information Technology for Economic and Clinical Health (HITECH) Act, Title XIII of Division A and Title IV of Division B of the American Recovery and Reinvestment Act of 2009, Pub L No. 111-5, 123 Stat 226 (2009).
24. Unger JM, Cook E, Tai E, Bleyer A. The role of clinical trial participation in cancer research: barriers, evidence, and strategies. Am Soc Clin Oncol Educ Book. 2016;35:185-198. doi:10.1200/EDBK_156686
25. Centers for Medicare & Medicaid Services. National Coverage Determination 310.1: Routine Costs in Clinical Trials. Medicare Coverage Database. Effective July 9, 2007. Accessed October 22, 2026. https://www.cms.gov/medicare-coverage-database/
26. Office of the National Coordinator for Health Information Technology. Trusted Exchange Framework and Common Agreement (TEFCA). US Department of Health and Human Services. Accessed October 22, 2026. https://healthit.gov/policy/tefca/
27. Office of the National Coordinator for Health Information Technology. United States Core Data for Interoperability (USCDI). Interoperability Standards Platform. Accessed October 22, 2026. https://isp.healthit.gov/united-states-core-data-interoperability-uscdi
28. US Food and Drug Administration. Conducting Clinical Trials With Decentralized Elements: Guidance for Industry, Investigators, and Other Interested Parties. FDA; September 2024.
29. US Food and Drug Administration. Considerations for the Design and Conduct of Externally Controlled Trials for Drug and Biological Products: Guidance for Industry. FDA; February 2023.
30. European Medicines Agency, Committee for Medicinal Products for Human Use. Qualification Opinion for Prognostic Covariate Adjustment (PROCOVA). EMA; September 2022.
31. US Food and Drug Administration. Adjusting for Covariates in Randomized Clinical Trials for Drugs and Biological Products: Guidance for Industry. FDA; May 2023.
32. Schuler A, Walsh D, Hall D, Walsh J, Fisher C. Increasing the efficiency of randomized trial estimates via linear adjustment for a prognostic score. Int J Biostat. 2022;18(2):329-356. doi:10.1515/ijb-2021-0072
33. Electronic Records; Electronic Signatures. 21 CFR Part 11 (2026).
34. US Food and Drug Administration. Data Integrity and Compliance With Drug CGMP: Questions and Answers. Guidance for Industry. FDA; December 2018.
35. International Society for Pharmaceutical Engineering. GAMP 5: A Risk-Based Approach to Compliant GxP Computerized Systems. 2nd ed. ISPE; 2022.
36. US Food and Drug Administration. Computer Software Assurance for Production and Quality System Software: Guidance for Industry and Food and Drug Administration Staff. FDA; September 24, 2025. Docket FDA-2022-D-0795. Reissued as Computer Software Assurance for Production and Quality Management System Software, February 3, 2026.
37. Hughes SS. Genentech: The Beginnings of Biotech. University of Chicago Press; 2011.
ABOUT THE AUTHOR Michelle Longmire, MD, is a physician-scientist and the co-founder and CEO of Medable, a clinical trial technology company building agentic AI systems for clinical development. Dr. Longmire is a board-certified dermatologist and trained at Stanford University. She is the author of numerous peer-reviewed publications and her work spans entrepreneurship, translational science, and clinical research.